Skip to content

Yichi's Blog

Thinking Like A Data Scientist

  • Home
  • About Me
  • CV

Tag: Plotly

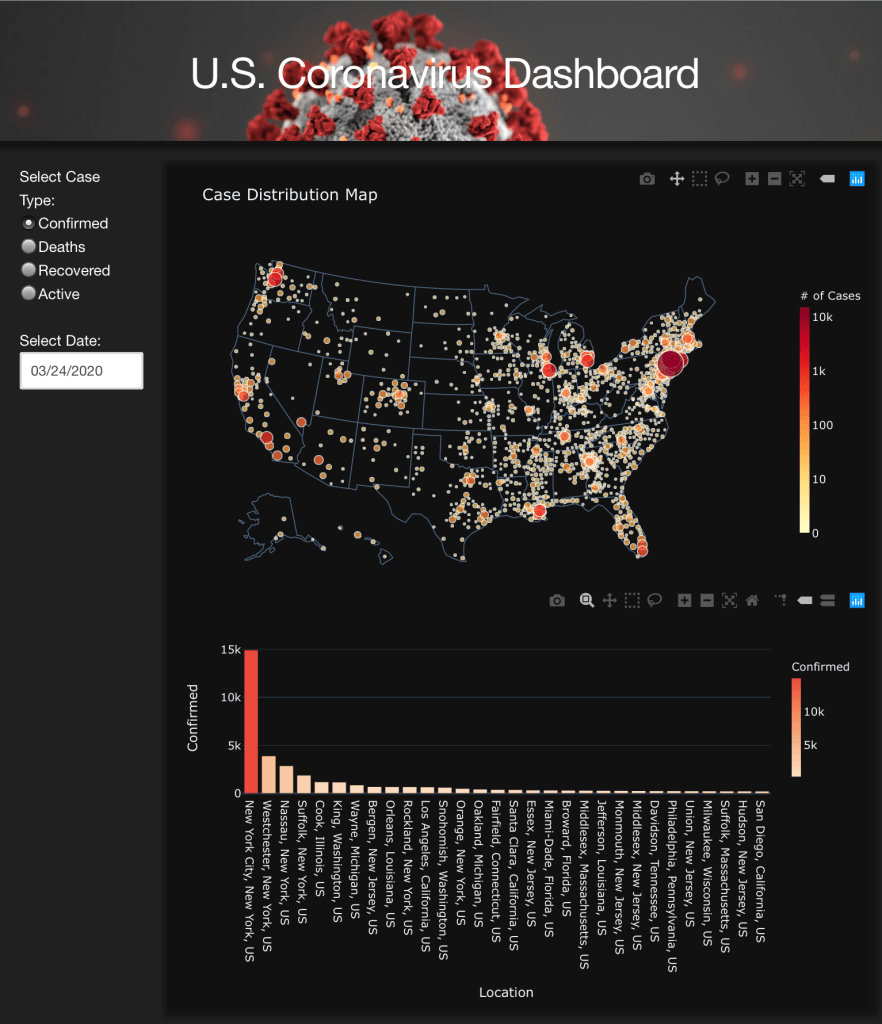
Build An Interactive U.S. COVID-19 Cases Dashboard Using Dash and Heroku

I built an interactive dashboard to help me track the status of COVID-19 in the US. It was built using Dash by Plotly and deployed to Heroku. It refreshes daily. Check it out here.

Yichi Zhang Data Science Leave a comment March 24, 2020March 25, 2020 1 Minute

Search

Enter your email address to follow this blog and receive notifications of new posts by email.

Join 4 other subscribers
Powered by WordPress.com.
  • Follow Following
    • Yichi's Blog
    • Already have a WordPress.com account? Log in now.
    • Yichi's Blog
    • Customize
    • Follow Following
    • Sign up
    • Log in
    • Report this content
    • View site in Reader
    • Manage subscriptions
    • Collapse this bar
 

Loading Comments...